Evidence-backed work across aviation, technology, civic development, reporting, and executive strategy.
These case studies explain what the project required, what I personally contributed, how the work was completed, and what the evidence supports. Individual contribution is separated from team and organization outcomes. Confidential client data is excluded, and metrics appear only when their scope, period, and attribution are clear.
Passenger Research for Tampa International Airport’s Airside D Concessions Planning
Hillsborough County Aviation Authority
Tampa International Airport
Government and Aviation
Role: Contributor responsible for individual passenger-intercept fieldwork and research support
Context
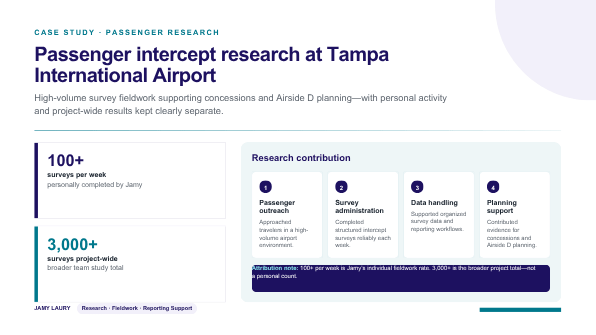
Tampa International Airport’s Airside D program created a need for passenger preference research related to concessions planning. HCP Associates and Paslay Group supported the broader Hillsborough County Aviation Authority research effort, which used in-person intercepts to gather feedback relevant to shopping and dining decisions.
The assignment required consistent field execution in a major airport environment, careful survey administration, and clear separation between an individual fieldworker’s contribution and the scale of the full project.
Collect reliable passenger input in an active operating environment.
The project needed a substantial body of structured passenger feedback. Each completed intercept had to contribute to a broader research design without allowing speed, traffic flow, or the complexity of the airport environment to undermine data quality.
My role
I contributed individual fieldwork and research support. I did not own the overall methodology, quota structure, project management, or final institutional decisions.
Actions
- Administered in-person passenger intercept surveys at Tampa International Airport.
- Completed at least 100 surveys per week during my fieldwork.
- Followed the project’s survey process while working in a high-traffic environment.
- Supported research-data handling and reporting.
- Maintained the distinction between my personal completed surveys and the broader project total.
Tools and methods
In-person intercept research, structured survey administration, SurveyMonkey, Excel, data handling, and reporting support.
Deliverables
Completed passenger survey records, structured research inputs, and reporting support for the broader concessions-planning study.
Evidence-supported result
I completed at least 100 passenger intercept surveys per week. HCP Associates reports that the broader HCAA and Paslay Group project conducted more than 3,000 intercepts.
Attribution boundary
The 100-per-week figure describes my individual fieldwork. The more-than-3,000 figure describes the full project and must not be attributed to me personally. I do not claim sole project ownership, authorship of the complete research methodology, or personal causation of airport decisions.
Confidentiality boundary
This case uses public project context and approved contribution details. It does not disclose unpublished passenger findings, raw survey records, confidential research outputs, or participant information.
Relevance to target roles
The work demonstrates structured data collection, operational discipline, research quality, stakeholder context, and the ability to contribute reliably within a larger analytical project.
Relevant roles: Business Analyst, Research Analyst, Reporting Analyst, and operations-oriented analyst roles.
Building Decision-Ready Reporting Across a Multi-Industry Agency Portfolio
HCP Associates
Multi-industry agency portfolio
Business Reporting and Performance Analysis
Role: Lead for reporting and dashboard-development workstreams; co-owner of campaign management and optimization
Context
Recurring agency reporting brought together data from organizations with different business models, audiences, lead definitions, funding structures, campaigns, and reporting cadences. Work spanned environments such as managed IT and cybersecurity, aviation, education, hospitality, nonprofit services, construction, logistics, financial services, security, civic research, and B2B technology.
The reporting challenge was therefore not a single platform connection. It was creating consistent analytical communication without pretending that every account measured the same thing.
Make recurring performance data comparable enough to use without erasing important differences.
Platform data could include website activity, form submissions, conversions, qualified leads, campaign results, funding categories, individual entities, account totals, and different reporting periods. Those measures needed to be organized, interpreted, and communicated without being treated as interchangeable.
My role
I led recurring Google Ads and GA4 reporting and Looker Studio dashboard development. I co-owned campaign management and optimization with other HCP team members. Account results remained shared client and team outcomes rather than personal causal impact.
Actions
- Reviewed paid-media, website, form, and lead activity.
- Organized reporting by account, entity, platform, campaign, and period.
- Built and maintained reusable Looker Studio reporting structures.
- Checked the meaning of fields before comparing or summarizing them.
- Distinguished form submissions, platform conversions, and qualified leads.
- Identified anomalies or inconsistencies for review.
- Translated detailed platform data into charts, narrative summaries, and client-ready reporting.
- Supported performance and optimization discussions while preserving shared ownership.
Tools and methods
Google Looker Studio, GA4, Google Ads, Meta Ads, LinkedIn Ads, Excel, PowerPoint, KPI interpretation, data visualization, reporting QA, and stakeholder communication.
Deliverables
Recurring performance reports, Looker Studio dashboards, visual summaries, analytical observations, and presentation-ready reporting materials.
Evidence-supported result
The work created more consistent, reusable views of multi-platform performance and supported clearer conversations about what each measure represented. It enabled better separation of unlike metrics and more useful reporting discussions.
No quantified time-saving, performance lift, or complete dashboard count is claimed.
Attribution boundary
I led reporting and dashboard work and co-owned campaign management. Strategy, execution, client decisions, and account performance involved other HCP colleagues and client stakeholders. Campaign totals are not presented as outcomes I caused.
Confidentiality boundary
This case does not expose raw client datasets, account totals, private screenshots, unpublished lead counts, date-ambiguous campaign metrics, or client-identifiable performance details that are not approved for public use.
Relevance to target roles
The work demonstrates recurring BI and reporting responsibility, metric-definition discipline, cross-platform interpretation, reporting operations, anomaly review, and the ability to communicate findings across varied business contexts.
Relevant roles: BI Analyst, Reporting Analyst, Marketing Data Analyst, Business Analyst, Revenue Operations Analyst, Growth Operations Analyst, and Marketing Operations Analyst.
Standardizing B2B Lead Data for Downstream CRM and ERP Workflows
Source 1 Solutions
Managed IT and Cybersecurity
Lead Operations and Data Preparation
Role: Lead for the documented data-formatting workflow, with related reporting and marketing-operations responsibilities

Context
Source 1 Solutions operates across managed IT, cybersecurity, RF, electronic-component sourcing, and security and surveillance services. Lead operations in that environment required ZoomInfo source files to be prepared in a structure suitable for NetSuite-oriented downstream use.
Source lead files did not consistently match downstream requirements.
Differences in field names, ordering, formatting, and required output structure created repetitive preparation work and increased the risk of inconsistent imports. The process needed a clearer mapping from source fields to the destination-ready file.
My role
I led the documented formatting workflow. Source 1 and HCP stakeholders defined the downstream needs and used the resulting files. I did not own NetSuite administration, CRM implementation, ERP implementation, or a direct systems integration.
Source-file inconsistencies
The workflow began by identifying where ZoomInfo exports differed from the structure needed downstream. This included field naming, column order, formatting conventions, and values that required consistent handling before import.
Destination requirements and field mapping
I translated the downstream file requirements into a field-mapping structure: what each source column represented, where it belonged in the output, which fields required standardized formatting, and which values needed review rather than automatic transformation.
Transformation logic
I used Python-assisted formatting to reorganize and standardize the lead data. The workflow was designed to produce a more consistent output file for import preparation while keeping the process bounded to the documented source and destination structures.
Validation
Validation focused on whether expected fields were present, whether output formatting matched the defined structure, and whether records requiring review were identifiable before downstream use.
Exception handling
Values that did not fit the standard mapping required explicit review. The process was intended to make exceptions visible rather than force uncertain values into an incorrect format.
Downstream use and documentation
The prepared output supported downstream CRM and ERP-oriented lead operations. The reusable value was a clearer relationship among the source file, destination requirements, transformation steps, validation checks, and final handoff.
Tools and methods
Python-assisted formatting, ZoomInfo, NetSuite-oriented file preparation, field mapping, standardization, validation, exception review, and process documentation.
Deliverables
A standardized lead-data output and a repeatable preparation workflow for downstream use.
Evidence-supported result
The workflow standardized lead-file preparation and clarified the path from source data to a destination-ready output. No measured time savings, error reduction, throughput volume, or business-performance result is claimed.
Attribution boundary
I led the formatting workflow. Stakeholders supplied destination requirements and controlled downstream systems and use. The project should be described as Python-assisted data standardization and import preparation—not direct API integration, production ETL, pipeline engineering, CRM implementation, or ERP implementation.
Confidentiality boundary
No raw lead records, personal information, customer information, financial information, account totals, private screenshots, source code, or internal system configuration is shown.
Relevance to target roles
The work demonstrates process analysis, source-to-destination thinking, field mapping, data standardization, validation, exception handling, documentation, and cross-functional handoff.
Relevant roles: Revenue Operations Analyst, Growth Operations Analyst, Marketing Operations Analyst, Business Analyst, CRM Operations Analyst, and reporting-oriented systems roles.
Turning Resident and Worker Feedback into Decision-Ready District Research
City of Tampa and Ybor City Community Redevelopment Area
Westshore Alliance
Economic, Community, and Business-District Research
Ybor City and Westshore both required resident and worker research, but they were separate engagements with different stakeholders, workstream responsibilities, and evidence boundaries. This comparative case shows how a similar research discipline can be adapted without merging metrics or ownership.
Shared analytical framework
Both studies required structured survey data to be organized into useful findings. The shared methods included survey administration or outreach, SurveyMonkey and Excel handling, grouping responses, creating PivotTables and charts, and supporting stakeholder communication.
The analytical standard was consistent: clarify who responded, distinguish collection from analysis, make visual summaries readable, and state whether a figure belongs to one contributor or the study as a whole.
Resident and worker research for a civic redevelopment district
City of Tampa
Ybor City Community Redevelopment Area
Economic and Community Development
Role: Co-owner of Jamy’s project workstream, including response collection, analysis support, and stakeholder reporting
Context and objective
The 2025 study continued a recurring effort to understand resident and worker priorities in the Ybor City district. The work needed both community outreach and a structured path from responses to tables, charts, and stakeholder-ready reporting.
My actions
- Participated in resident and worker outreach.
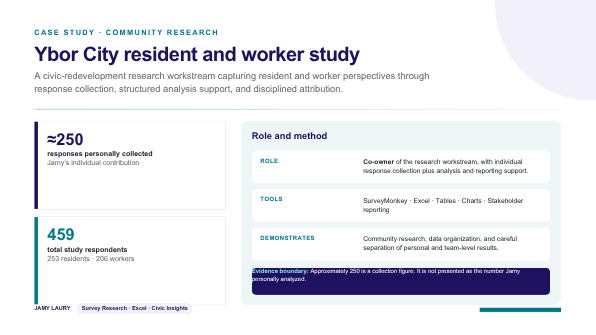
- Personally collected approximately 250 responses.
- Worked with SurveyMonkey and Excel.
- Supported tables, charts, analysis, and stakeholder reporting.
- Kept my personal collection volume separate from study-wide totals.
Tools and methods
SurveyMonkey, Excel, PivotTables, charts, community outreach, response collection, analysis support, and stakeholder reporting.
Deliverables
Collected responses, organized research inputs, analysis tables and charts, and reporting support.
Evidence-supported result
I personally collected approximately 250 responses. The public 2025 study totals were 253 resident respondents and 206 worker respondents.
Attribution and confidentiality boundary
The approximate 250 figure describes responses I personally collected; it does not establish that I personally analyzed every response. The 253-resident and 206-worker figures describe the full study. Unpublished findings, raw responses, and participant information are excluded.
Survey analysis and presentation support for a major business district
Westshore Alliance
Business District Research
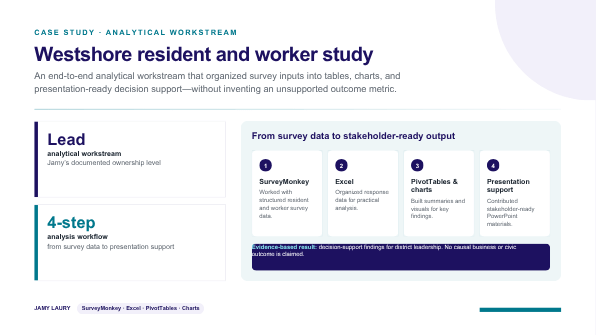
Role: Lead for Jamy’s analytical workstream and support for the overall client presentation
Context and objective
The 2025 engagement was the fourth iteration of a recurring Westshore resident and worker study. District leadership needed survey findings organized into a form suitable for review and discussion.
My actions
- Worked with SurveyMonkey and Excel data.
- Grouped responses for analysis.
- Built PivotTables, charts, and graphs.
- Supported the final PowerPoint.
- Participated in outreach and community activation.
- Led my analytical workstream while supporting the overall team presentation.
Tools and methods
SurveyMonkey, Excel, PivotTables, data grouping, charts and graphs, PowerPoint, research synthesis, and presentation support.
Deliverables
Analysis outputs, charts and graphs, and client-ready presentation materials.
Evidence-supported result
The work converted survey responses into decision-support findings for district leadership. No individual outcome metric or measured business result is claimed.
Attribution and confidentiality boundary
I led my analytical workstream, not the complete study or every presentation activity. HCP’s broader team scope and my specific contribution remain separate. This case excludes raw survey data, unpublished findings, unsupported sample sizes, and participant information.
What the two studies demonstrate together
The projects show how a repeatable research framework can support different district environments. Ybor emphasized my direct field collection alongside analysis and reporting support. Westshore emphasized leadership of my analytical workstream and support for the client presentation.
Together, the work demonstrates survey research, stakeholder variation, data grouping, Excel analysis, visualization, public-sector and business-district context, and decision-ready communication—while preserving the distinction among field collection, analytical ownership, and team presentation responsibility.
Relevance to target roles
The work is relevant to Business Analyst, Research Analyst, Reporting Analyst, BI-adjacent, and operations roles that require structured input, analytical grouping, visualization, stakeholder communication, and careful attribution.
Converting Executive Interviews into an Audience-Growth Strategy
Florida Trend
University of South Florida
Business Media and Executive Audiences
Role: Marketing intern and academic client-project participant
Context
Florida Trend sought a marketing plan that could strengthen relevance with C-suite audiences. The academic client project required primary research, audience interpretation, strategic recommendations, and an executive presentation.
Turn qualitative executive input into a coherent audience strategy.
The project team needed to move from individual interview observations to a shared understanding of executive priorities, audience characteristics, and possible marketing approaches.
My role
I contributed as a marketing intern and academic client-project participant. I supported the research and strategy work, helped develop audience personas and recommendations where supported by the project, and participated in the presentation to Florida Trend executives.
Actions
- Contributed to executive-audience research.
- Supported interviews completed across the project team.
- Helped synthesize qualitative findings.
- Contributed to persona and recommendation development.
- Supported preparation of the C-suite-focused marketing plan.
- Presented recommendations with the project team to Florida Trend executives.
Tools and methods
Primary executive interviews, qualitative research synthesis, audience analysis, persona development, marketing planning, PowerPoint, and team presentation.
Deliverables
A C-suite-focused marketing plan and executive presentation.
Evidence-supported result
The project team conducted ten executive interviews and converted the resulting audience research into strategic recommendations presented to Florida Trend executives.
Attribution boundary
Ten interviews is the project-team total. I do not claim that I personally conducted all ten interviews, solely authored the plan, held executive strategic authority, or caused an audience, campaign, or revenue result.
Confidentiality boundary
This case presents the public-safe project structure and team attribution. It does not disclose private interview notes, participant information, proprietary findings, or unpublished client materials.
Relevance to target roles
The work demonstrates qualitative research, audience analysis, synthesis, recommendation development, executive-stakeholder exposure, teamwork, and presentation skills.
Relevant roles: Business Analyst, Research Analyst, Marketing Data and Operations Analyst, and stakeholder-facing reporting roles.
Looking for an analyst who treats scope and attribution as part of the work?
I am interested in roles and projects where the analyst must connect source data, business context, process, and clear communication.