Selected work

Growth & marketing-analytics case studies
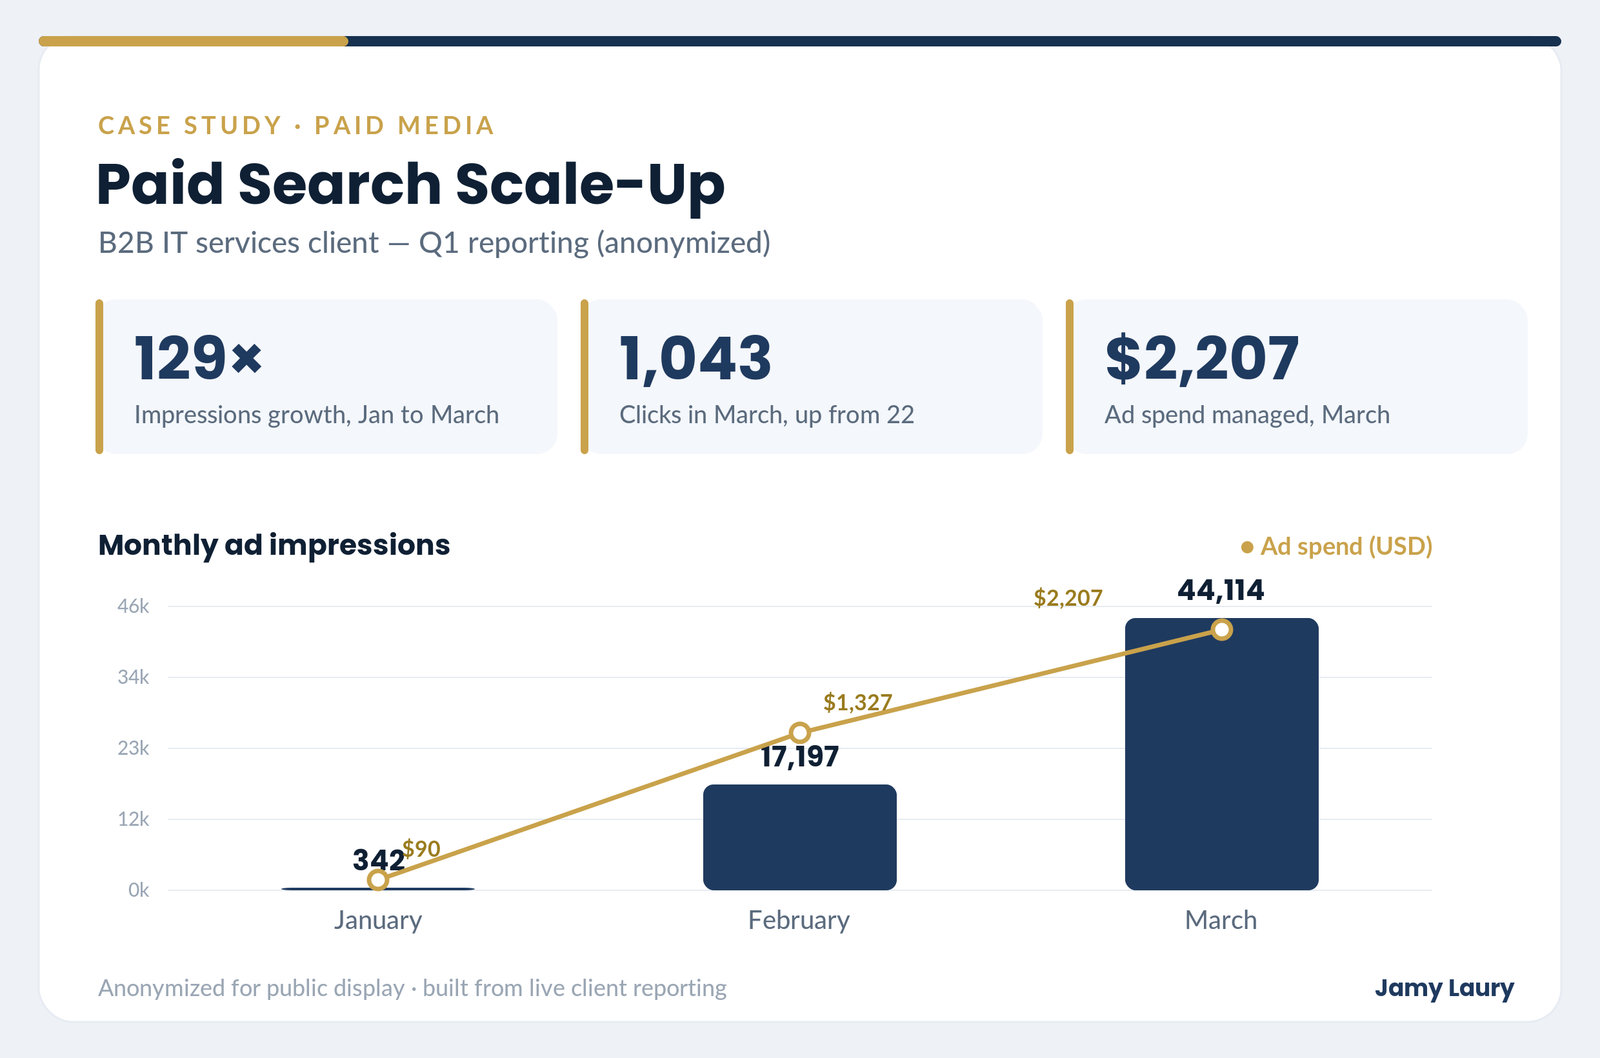
B2B IT & life-safety services · paid media + analytics
Challenge. Leadership was flying blind across three disconnected exports — paid search, website behavior, and organic — with no single read on what was working.
What I did. Built one monthly report unifying Google Ads, GA4 (site-wide and paid-traffic subsets), device mix, and Search Console into a client-ready narrative with clear next steps, and added LinkedIn Ads for a fuller B2B view.
Results. 6.43% paid-search CTR, $4.08 avg CPC, and $22.43 cost per acquisition; 3,677 users / 4,394 sessions; 515 organic clicks on 40.8K impressions — surfacing weak organic CTR and avg. position 19.1 as the top SEO priority. Across the quarter, paid search scaled from a few hundred to 44,114 monthly impressions (129×) as spend grew to ~$2,207/mo.
Google Ads · GA4 · Search Console · LinkedIn Ads · Looker Studio
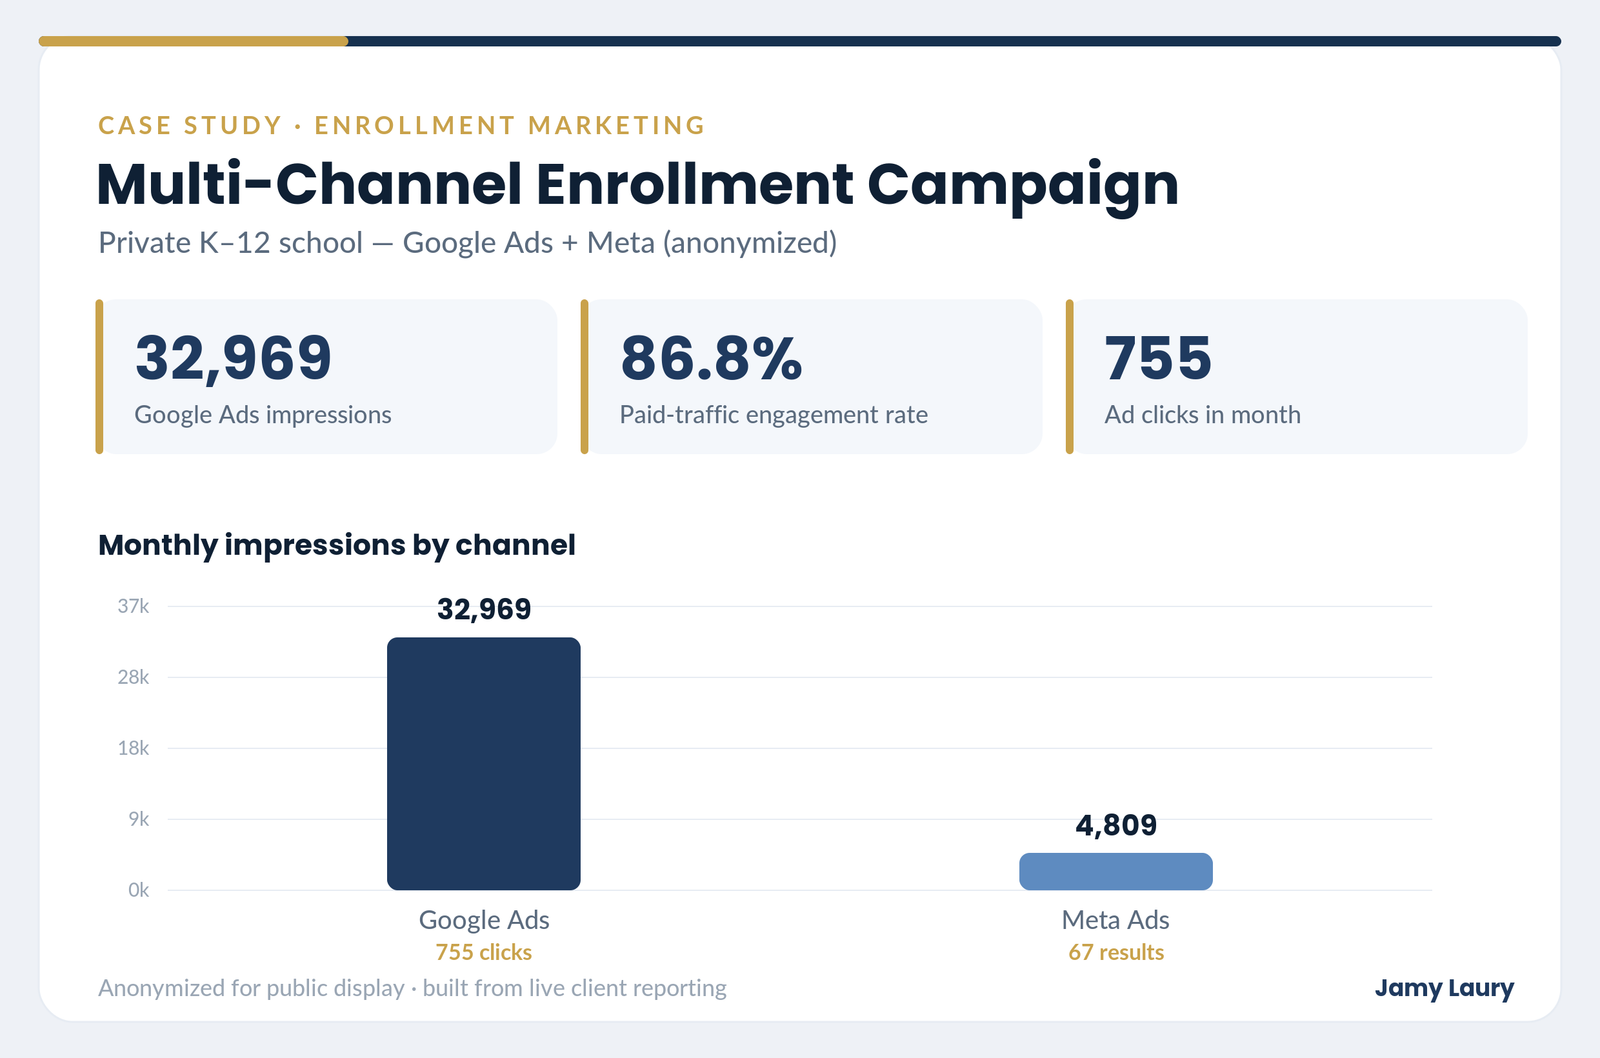
Private K–12 school · paid media + analytics
Challenge. Enrollment campaigns ran across Google Ads, Meta, and the website, but nobody could see how paid spend turned into engaged visitors.
What I did. Reported Google Ads (Performance Max + display), GA4 site-wide and paid-traffic performance, device mix, and Meta campaign metrics — then connected it with conversion-path and cross-device recommendations.
Results. 32,969 Google Ads impressions and 755 clicks in the month, an 86.8% engagement rate on paid traffic, and a Meta campaign delivering results at $0.58 per landing-page view — tying ad spend directly to on-site engagement so the school could see which channels drove real prospects.
Google Ads · Meta Ads · GA4 · Looker Studio
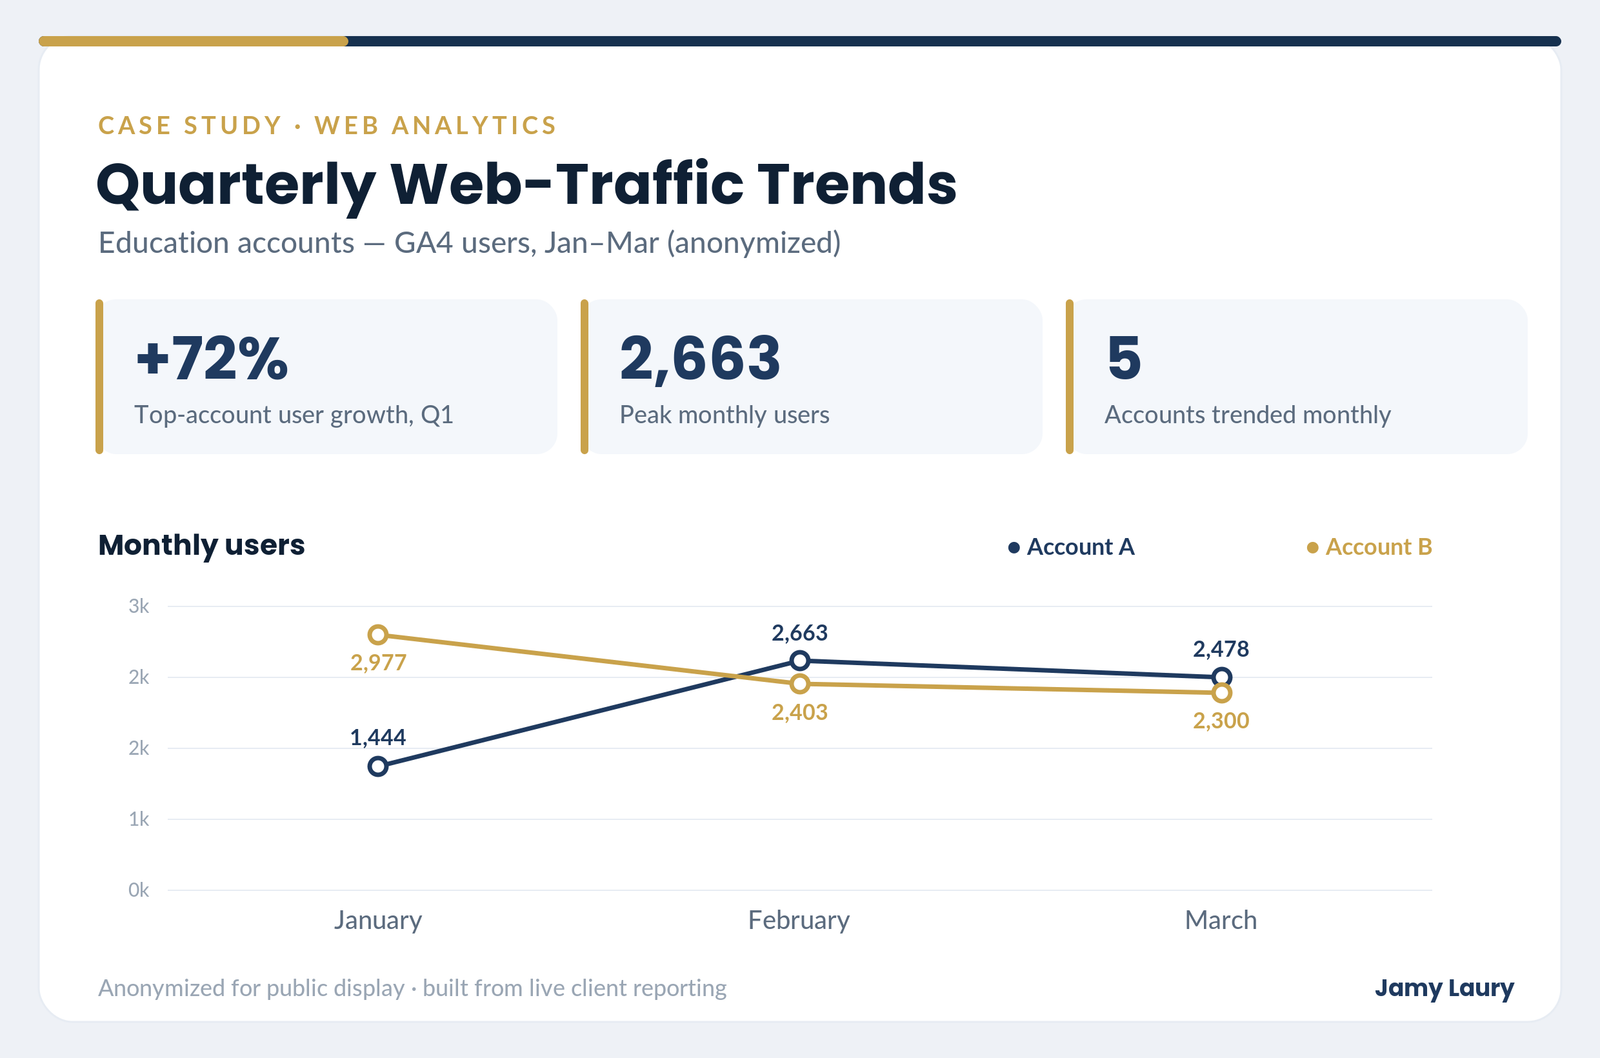
Education accounts · GA4 trend analysis
Challenge. Several education clients needed month-to-month visibility into campaign and site behavior — not just single-month snapshots.
What I did. Built Q1 trend views across five accounts — users, sessions, engagement rate, device mix, clicks, and spend — to make patterns obvious at a glance and flag accounts moving the wrong way.
Results. Surfaced clear, actionable stories: one brand’s users climbed from ~1,444 to 2,663 (+72%) over the quarter; another’s slipped, prompting an early budget conversation before the quarter closed. Monthly small-multiples became an early-warning system.
GA4 · Google Ads · Looker Studio
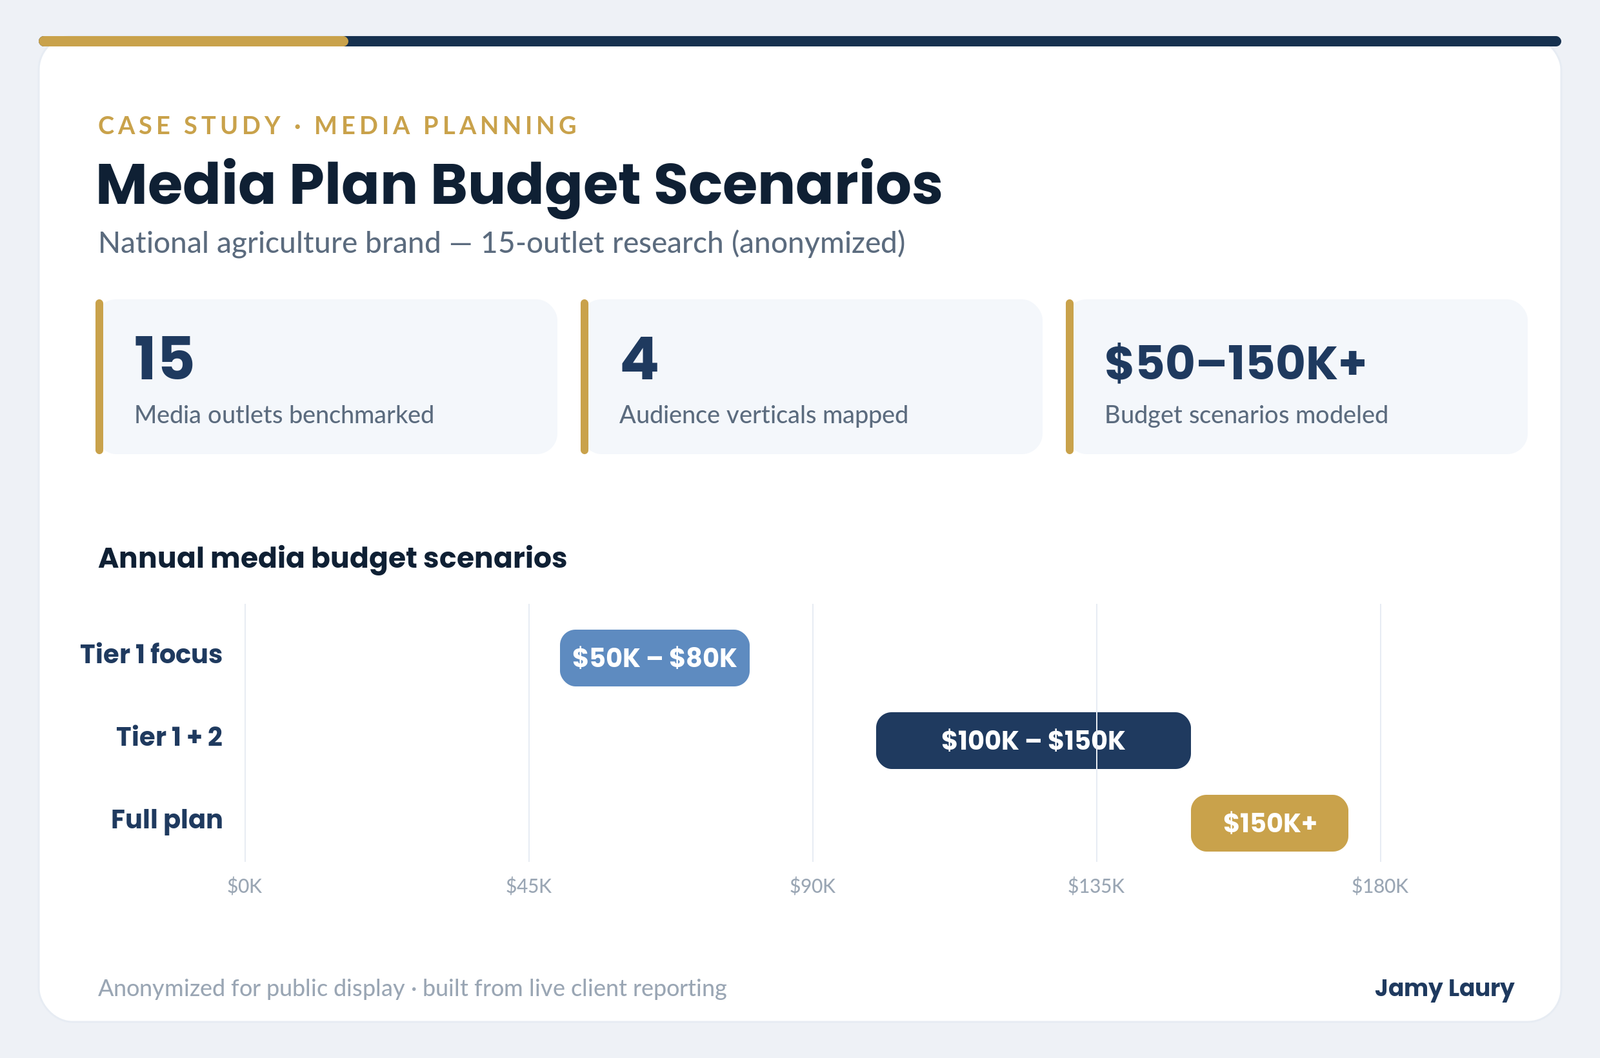
National turf & agriculture brand · media planning
Challenge. The client needed to know where to advertise — which outlets, which ad products, at what cost — with a defensible budget ahead of a leadership meeting.
What I did. Owned the media-planning workbook end to end: benchmarked 15 outlets across four audience verticals (golf, sports-field, commercial-landscape, homeowner), analyzed rate cards (impressions, clicks, CTR, placement cost), and built a priority matrix with tiered budget scenarios.
Results. A client-ready plan grouping outlets into tiers with budget ranges from ~$50–80K (Tier 1) up to $150K+ (full plan), backed by rate-card math (e.g., a billboard averaging ~18,000 impressions at $5,250 net) — turning an open-ended question into a budget-ready decision.
Excel · rate cards · priority matrix
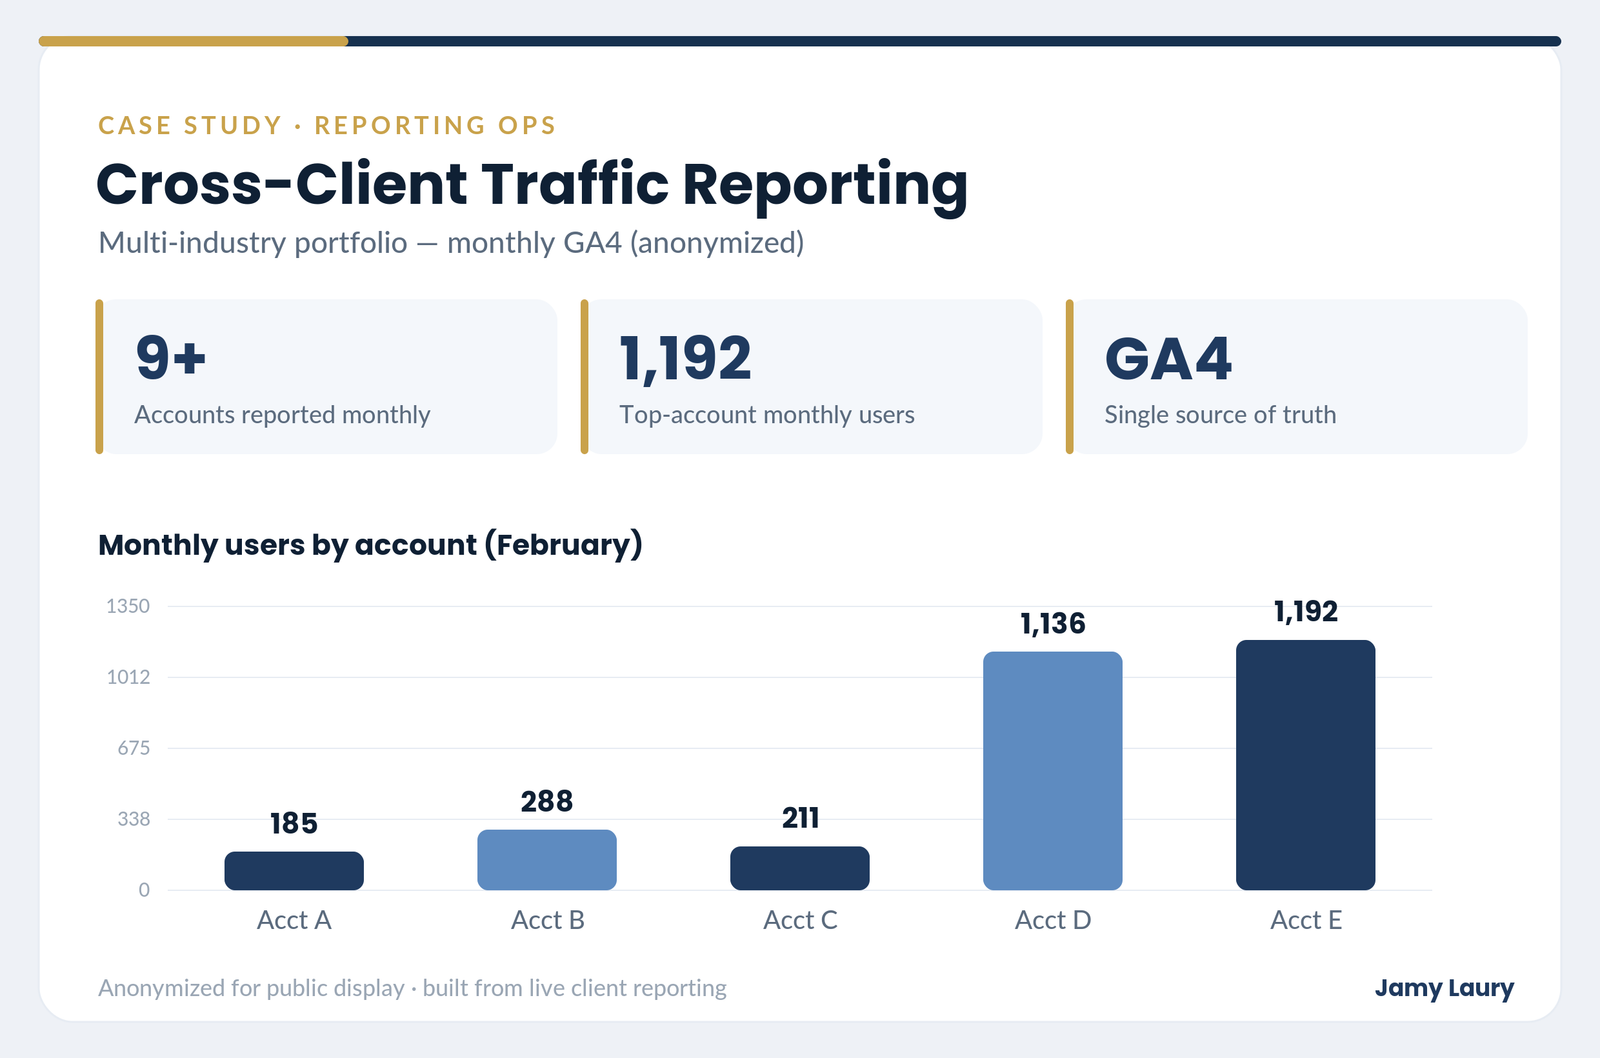
Multi-industry portfolio · reporting & analytics
Challenge. A book of 9+ accounts across industries needed consistent, trustworthy monthly reporting — from one source of truth, not ad-hoc exports.
What I did. Built and ran the month-end reporting system in GA4 and Looker Studio across the portfolio, standardized the KPIs, and monitored data quality — flagging spam/invalid-traffic spikes and odd geographies so the numbers people trusted were the right ones.
Results. 9+ accounts reported every month from a single GA4 source of truth, with February users ranging from 185 to 1,192 by account — consistent, on-time reporting that kept performance visible across the portfolio.
GA4 · Looker Studio · Google Ads · Google Sheets
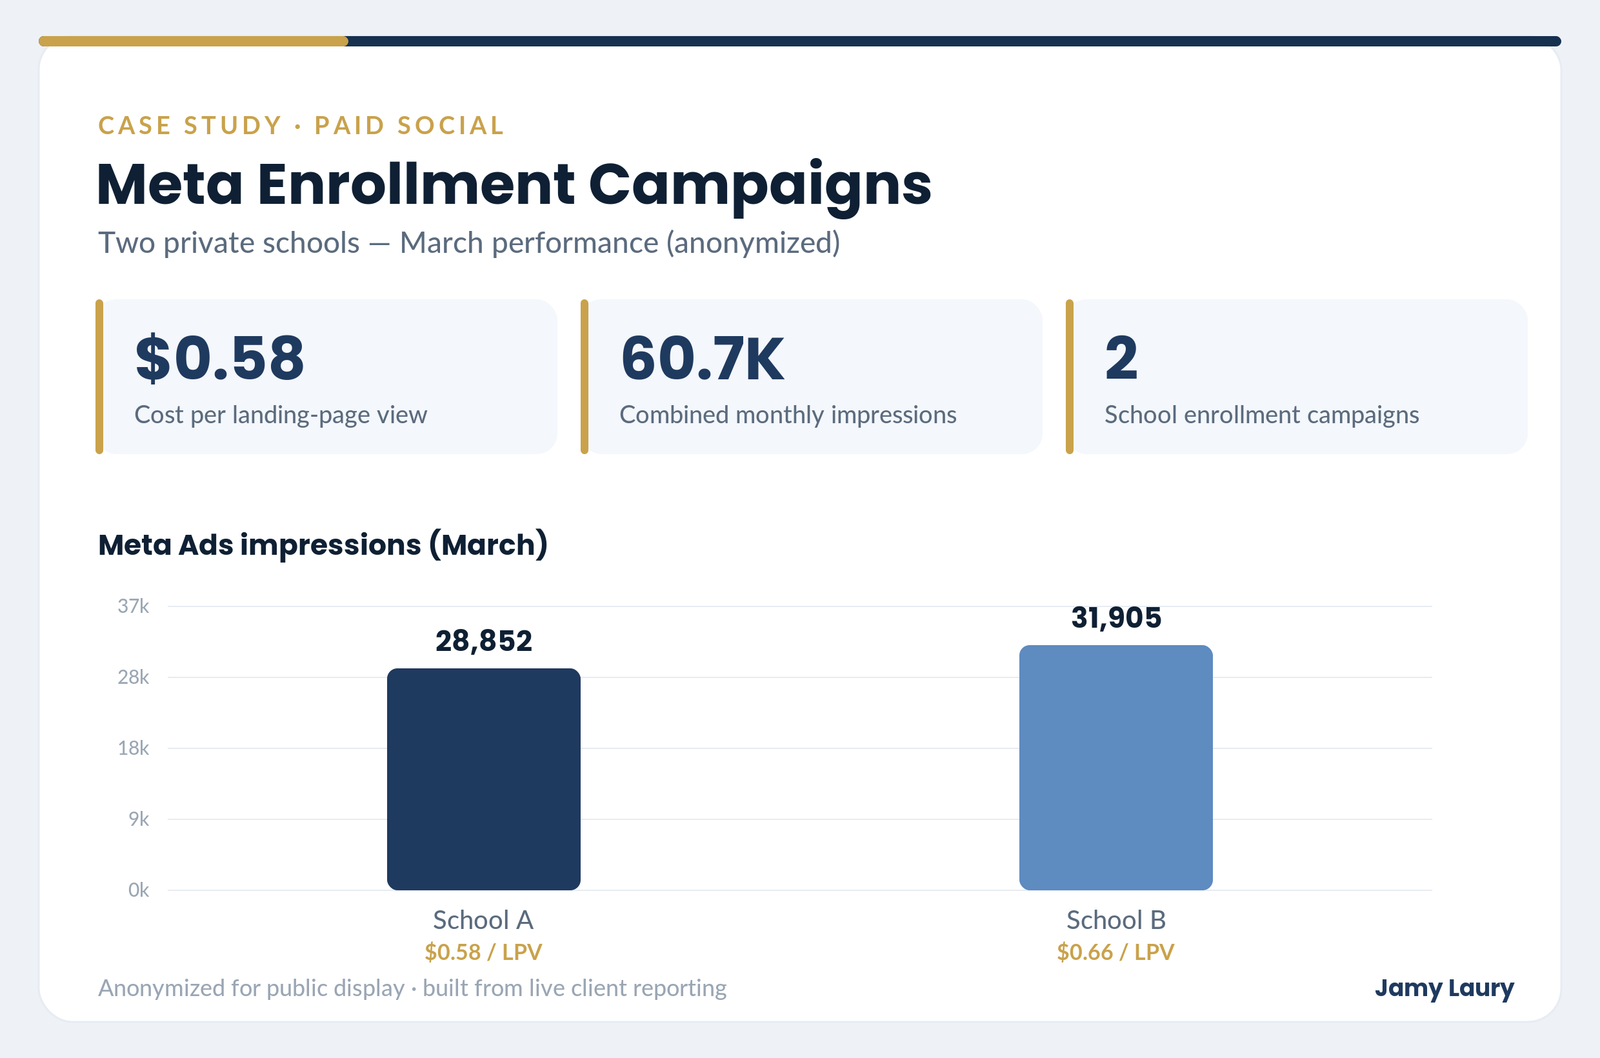
Two private schools · paid social (Meta)
Challenge. Two enrollment clients needed efficient Meta reach — and proof that paid social was earning its budget.
What I did. Ran and reported Meta enrollment campaigns side by side, tracking impressions, landing-page views, and cost efficiency to keep spend pointed at the better performer.
Results. 60.7K combined monthly impressions across the two schools at $0.58 and $0.66 per landing-page view — efficient, comparable paid-social performance that made budget decisions obvious.
Meta Ads · GA4 · Looker Studio